// energy forecasting · anomaly detection
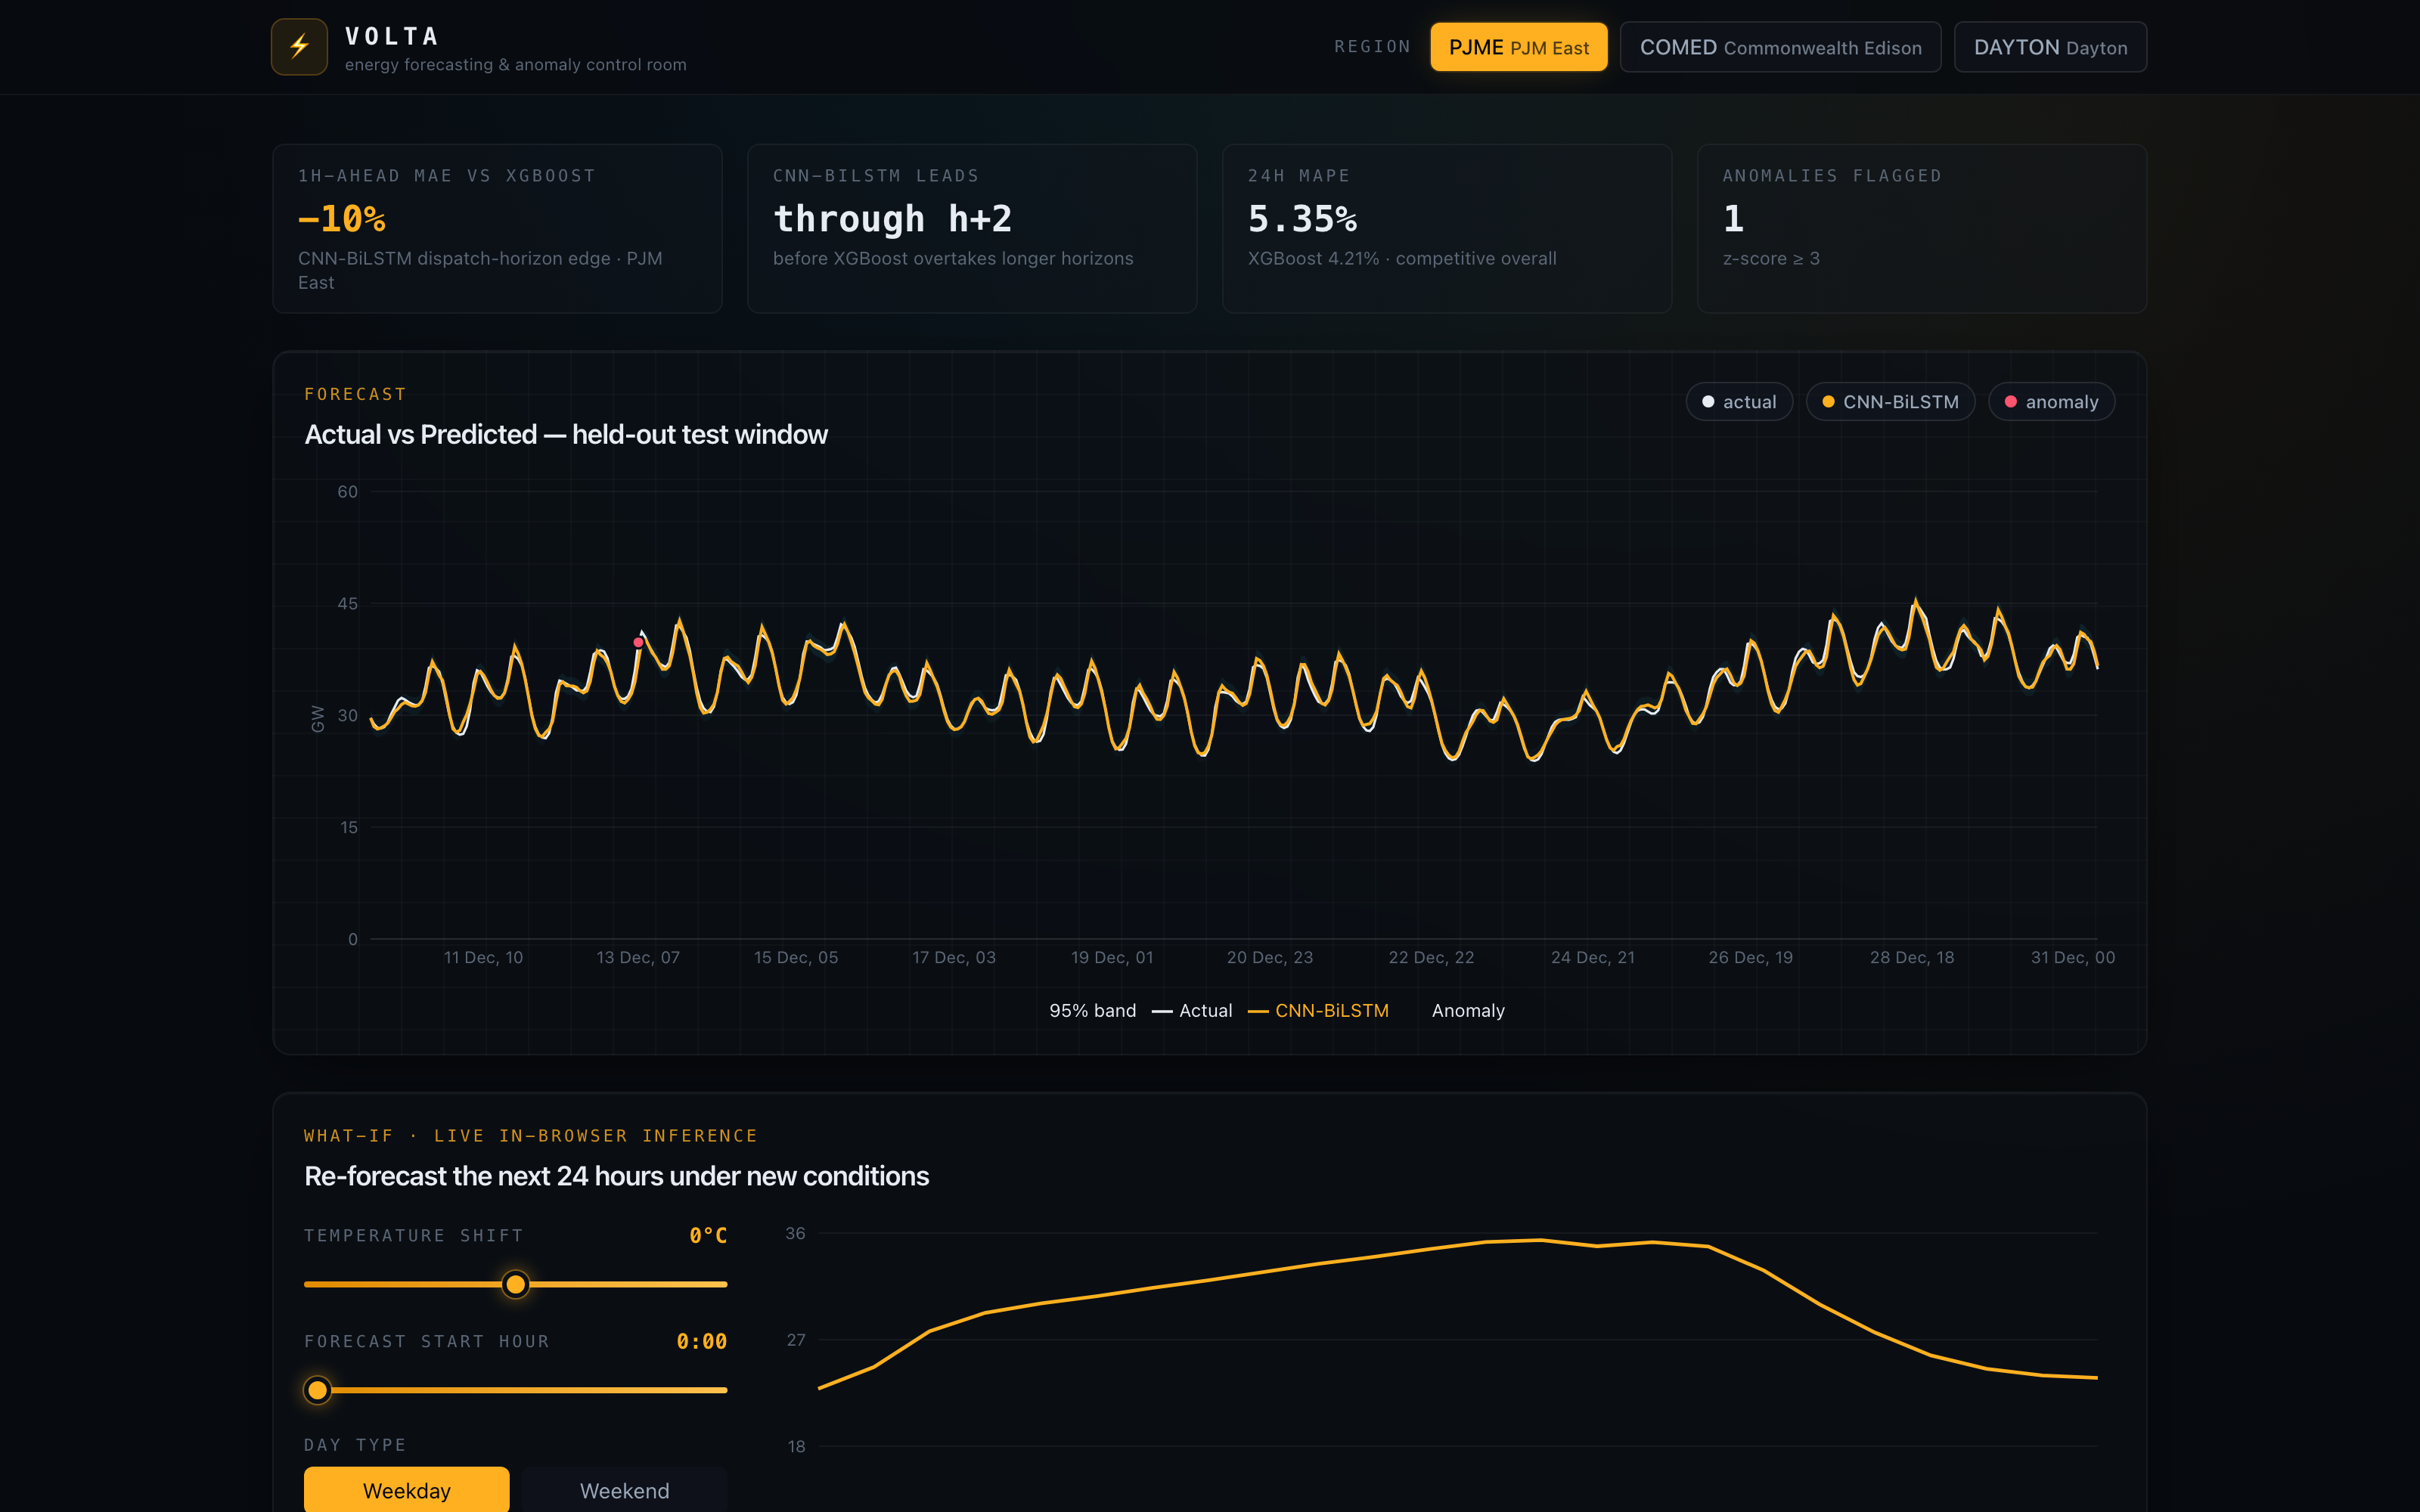
A deep-learning control room for the power grid — it forecasts the next 24 hours of energy demand, flags anomalies, and re-forecasts live in your browser as you change the weather.
−0%
1h-ahead MAE vs XGBoost
0.00%
24h MAPE · PJM East
0 zones
PJM East · ComEd · Dayton
$0
hosting · runs in-browser
// try it yourself
The real app, running right here.
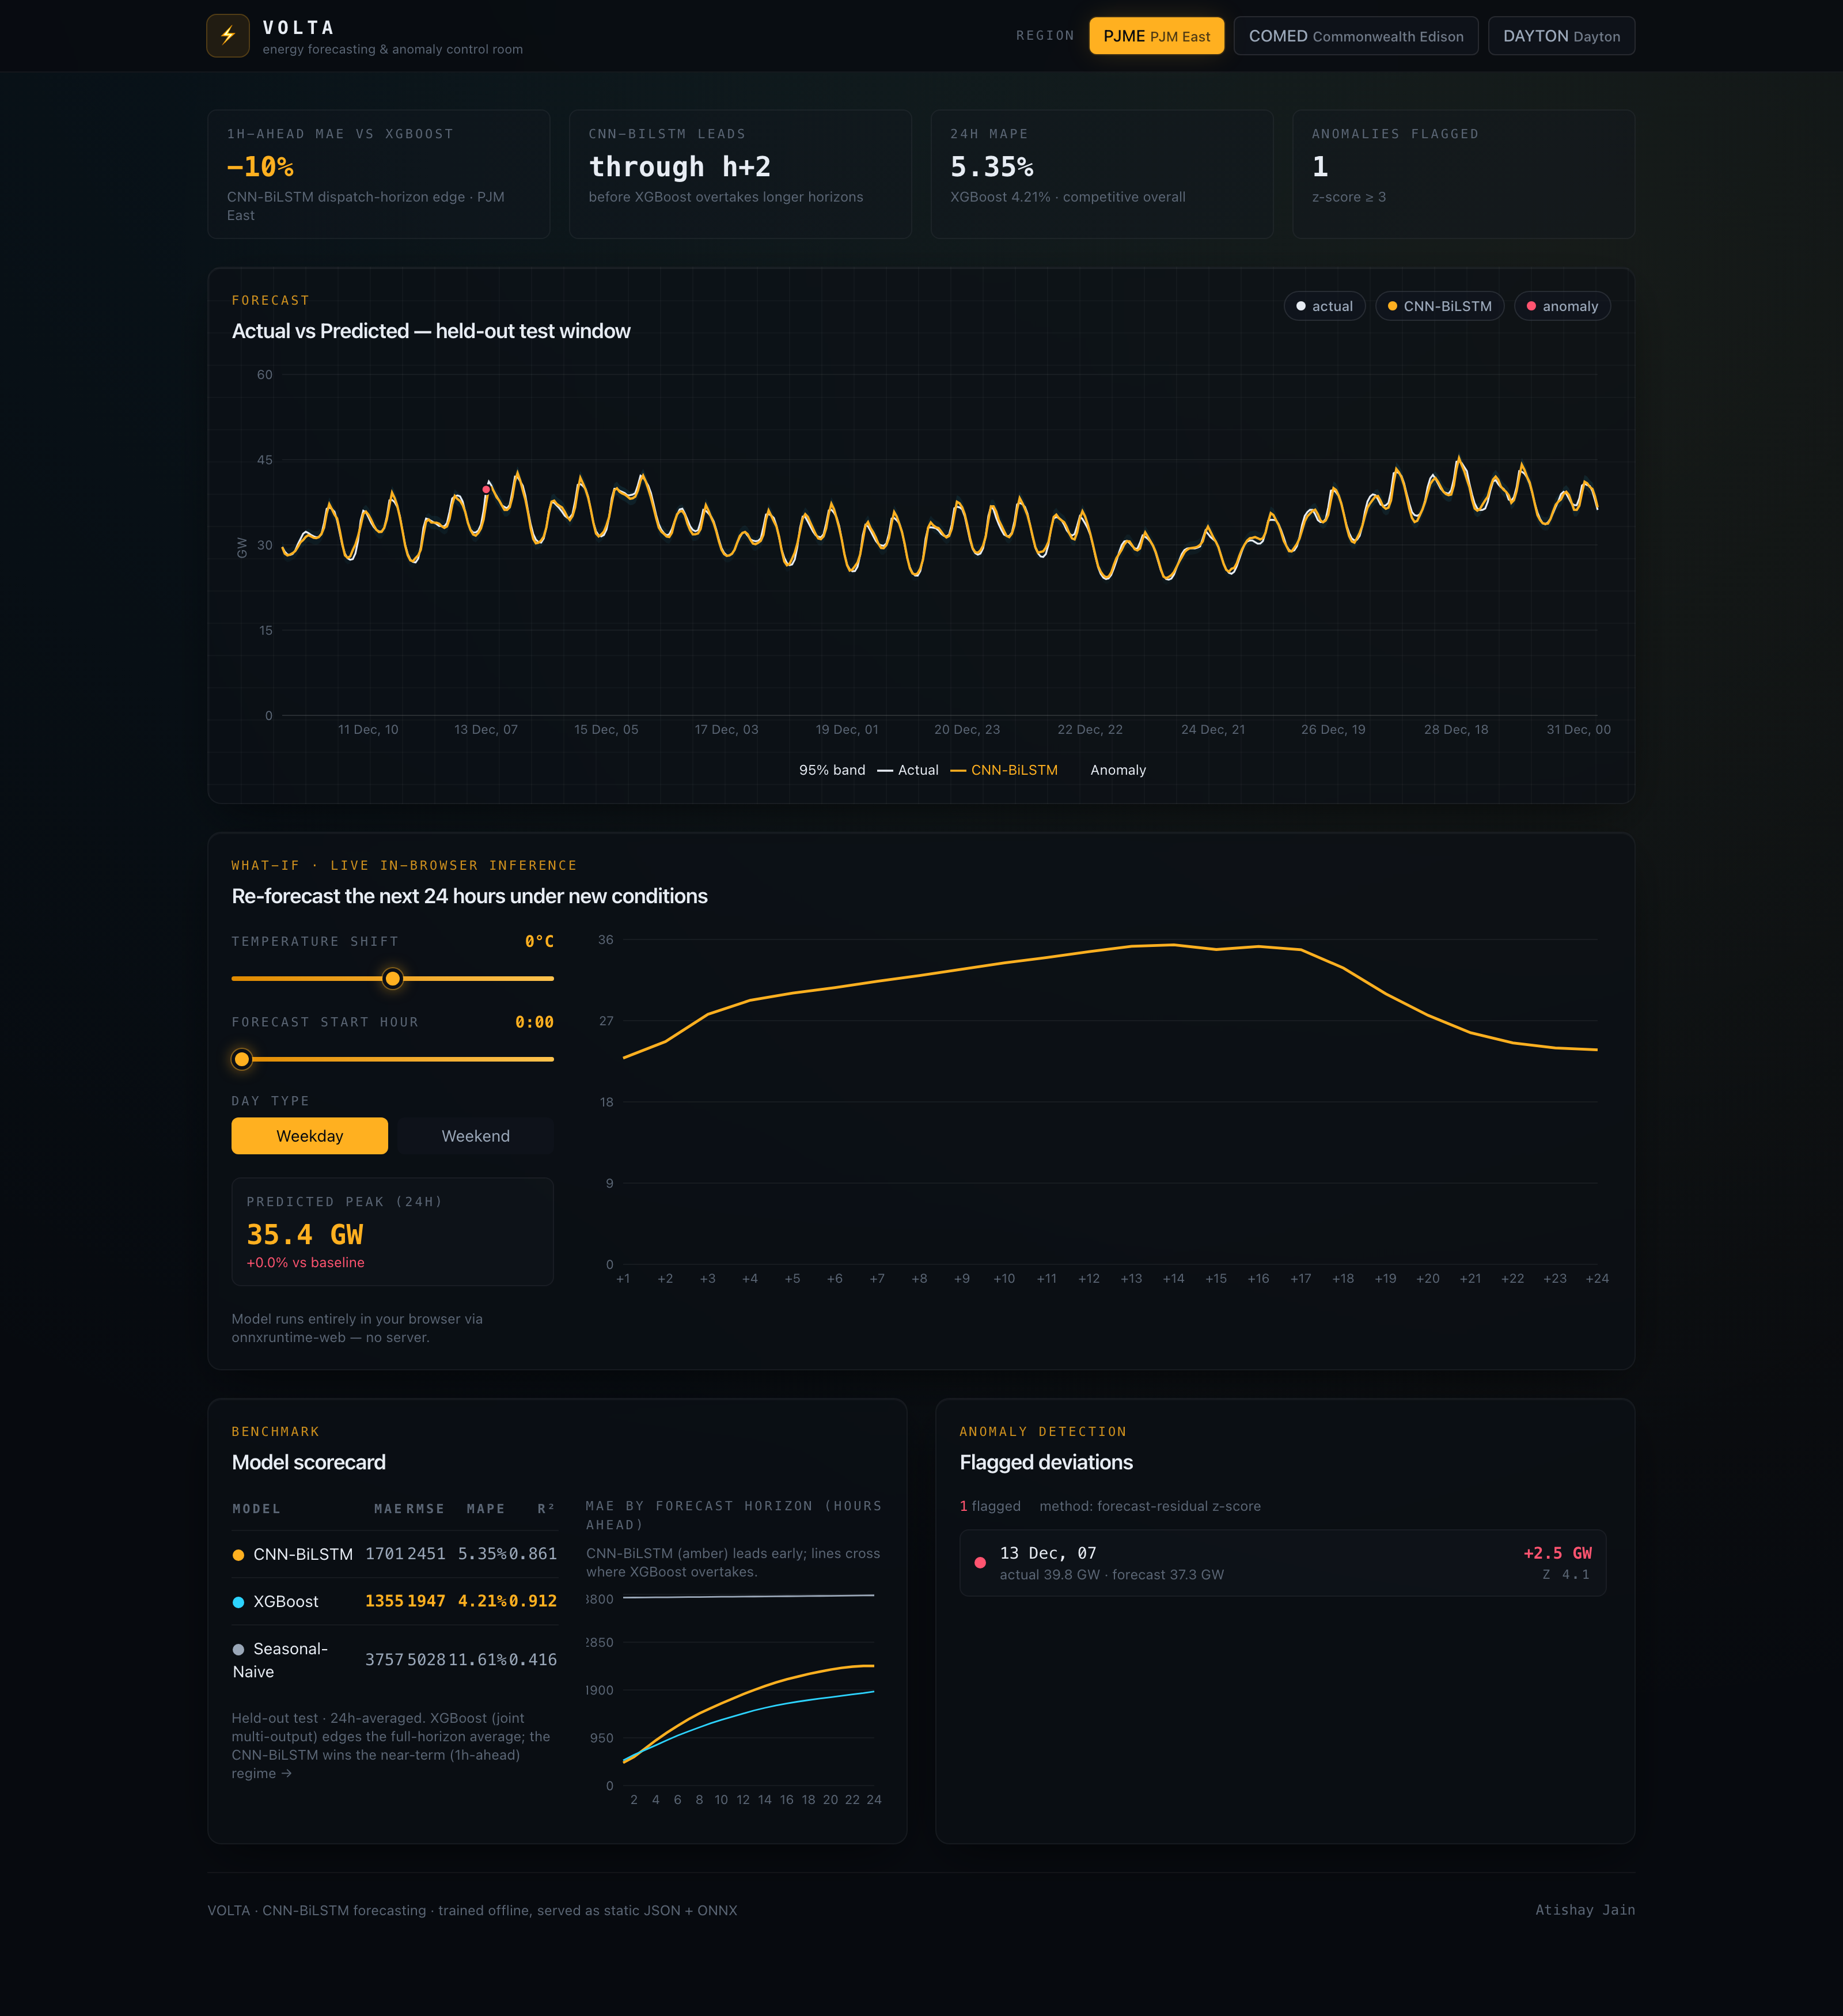
This is the live VOLTA deployment, embedded. Drag the temperature and the CNN-BiLSTM re-forecasts the next 24 hours — the model runs in your browser via ONNX, with no server behind it.
// how it works
From real grid data to an in-browser forecast.
01 · Ingest
Real grid + weather
PJM hourly demand joined with real hourly temperature from Open-Meteo — assembled by one key-less script.
pandas · Open-Meteo
02 · Forecast
CNN → Bi-LSTM
A one-week window of demand, weather and calendar features predicts the next 24 hours in a single shot.
PyTorch
03 · Detect
Anomalies
Forecast residuals are z-scored to flag demand that deviates sharply from the prediction.
Residual z-score
04 · Serve
Runs in your browser
Model exported to ONNX, results to static JSON — the what-if simulator runs inference client-side, no backend.
onnxruntime-web
// the model
A CNN-BiLSTM that learns the grid's rhythm.
A 168-hour window of 8 channels (load, temperature, cyclical hour & day-of-week, weekend, holiday) feeds a 1-D CNN feature extractor, a bidirectional LSTM, and a last⊕mean⊕max read-out that emits all 24 steps at once. The head predicts a correction to “same hour yesterday”, so it learns deviations from the daily rhythm rather than the raw level. One model is pooled across all three zones in normalised space, then exported to a single-file ONNX that runs in WASM.
Model scorecard · PJM East · held-out test window
| Model | MAE (MW) | RMSE (MW) | MAPE | R² |
|---|---|---|---|---|
| CNN-BiLSTM | 1701 | 2451 | 5.35% | 0.861 |
| XGBoost | 1355 | 1947 | 4.21% | 0.912 |
| Seasonal-Naive | 3757 | 5028 | 11.61% | 0.416 |
The CNN-BiLSTM wins the dispatch-critical near-term horizon — −10% MAE at 1-hour-ahead on PJM East, beating XGBoost at h+1 across all three zones and leading through h+2. Beyond a few hours, gradient-boosted trees edge the 24-hour average — a documented strength of trees on regular hourly load. VOLTA reports this transparently, with a per-horizon chart showing exactly where the models cross. Knowing where a model wins — and saying so — beats a cherry-picked number.
// what's inside
In-browser inference
The CNN-BiLSTM runs client-side via onnxruntime-web — no inference server, no cost.
Real, reproducible data
Real PJM demand + real Open-Meteo weather, assembled with no API keys.
Honest benchmarking
Per-horizon metrics show exactly where the model wins against a strong XGBoost baseline.
Anomaly detection
A residual z-score flags abnormal demand against the forecast.
Multi-zone
PJM East, Commonwealth Edison and Dayton, switchable live.
$0 hosting
Pure static export on Vercel's free tier — no backend, no GPU.
// under the hood
Serious machinery, zero servers.
The full stack behind VOLTA — modelling, data, web and in-browser inference. Scroll to spin it up.
// built, deployed, free
Trained offline. Runs in your browser.
An end-to-end energy-forecasting app built on real PJM grid data and real weather. A CNN→Bi-LSTM predicts 24h-ahead demand across three zones, a residual z-score detector flags anomalies, and a what-if simulator runs the trained model entirely in-browser via ONNX — trained offline, shipped as a static site with $0 hosting.